Overview:
- Learn to use the DIFOT Insights report
- Learn to use the Transport Insights report
Why Use Wiise DIFOT Dashboards in Power BI?
Wiise DIFOT Dashboards in Power BI gives your business the ability to monitor delivery performance by measuring whether deliveries arrive on time. Use these insights to improve freight, transport and shipping performance and streamline your supply chain operations.
Prerequisites:
- You have installed and connected Power BI
Tip: Hover over any dashboard tiles for tooltips and drill through to see detailed insights.
Before you Begin:
- Select the Period drop-down to select the date range for your DIFOT Insights or Transport Insights report:
- This week: From the first day of the week to today.
- This month: From the first day of the current month to today.
- This quarter: From the first day of the quarter to today.
- This fiscal year: As set up in Wiise (default: 1 July to 30 June).
- This calendar year: From 1 January to today.
- State: This is determined from your customer’s shipping location.
- Here’s what you need to know to read Wiise DIFOT Dashboards:
- Data is pulled from Posted Sales Shipment which represents your deliveries.
- The selected period is based on the Shipment Date
- Carrier refers to your Shipping Agent
- Type refers to your Shipping Method Code
- State refers to your Shipping State
- Fully shipped sales shipments are those delivered in full and on time.
Tip: To navigate any dashboard, you can hover for tooltips and drill through details.
How to Use Wiise DIFOT Dashboards in Power BI?
1. DIFOT Insights
- Select the DIFOT Insights menu on the left corner of the Wiise DIFOT Dashboards table menu.
- The DIFOT Insights Power BI reports display.
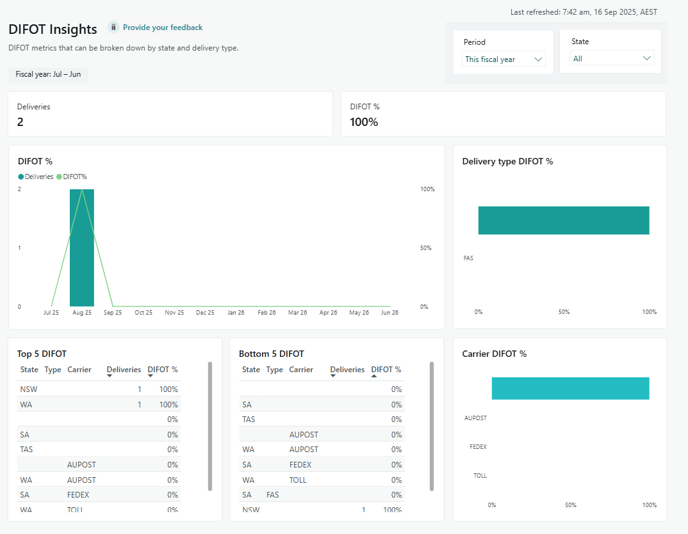
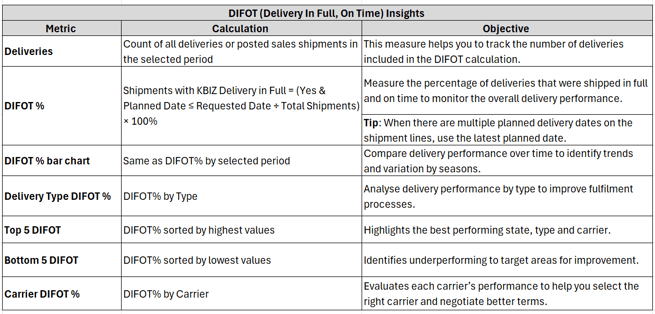
- Here’s how to read and understand the tiles on the DIFOT Insights report metrics.


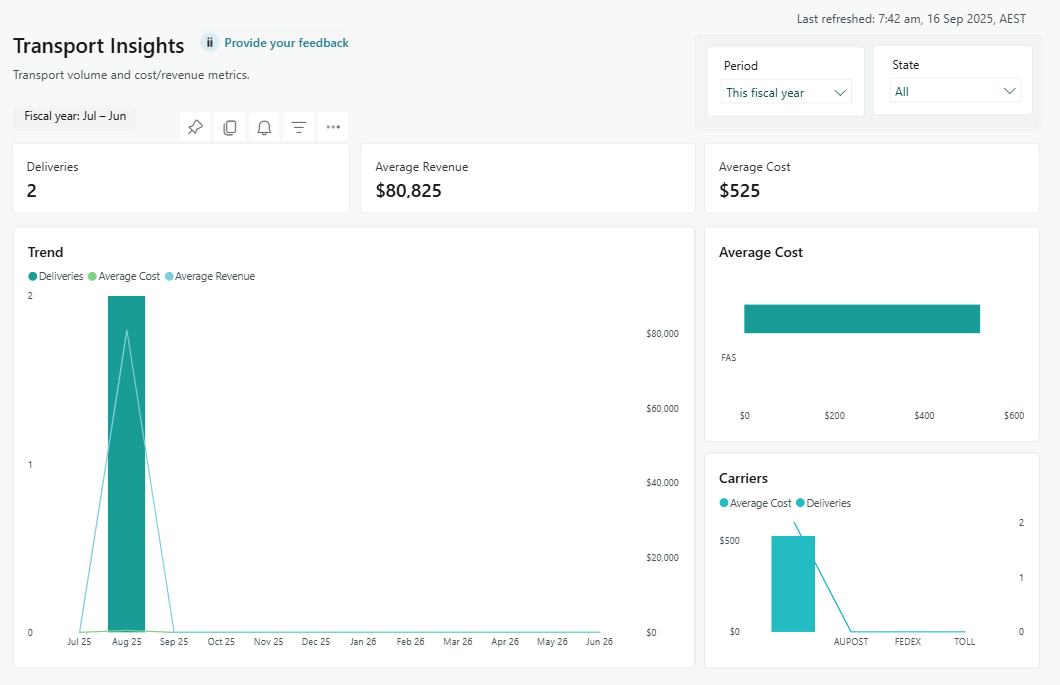
2. Transport Insights
- Select the Transport Insights menu on the left corner of the Wiise DIFOT Dashboards table menu.
- The Transport Insights Power BI reports display.

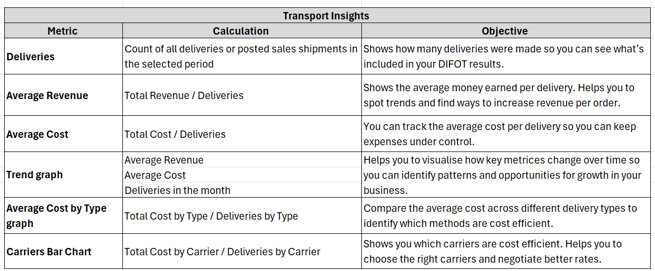
- Here’s how to read and understand the tiles on the Transport Insights report metrics
- You now know how to use the Transport Insights reports.

Note: Each Wiise Power BI dashboard includes a Provide your Feedback link. When you select it, a new tab opens where you can easily share your thoughts on the dashboard.

What’s next?
Find out how to refresh your Power BI dashboards.
Need more help?
No problem, that's what we're here for. Reach out to support@wiise.com anytime you can't find what you're looking for.