Overview:
- Learn to navigate your Wiise Warehouse Dashboards in Power BI
Why Navigate Wiise Warehouse Dashboards in Power BI?
Navigate Wiise dashboards in Power BI to view all your business data in one place. You can filter, drill into details and get clear insights in making quicker decisions for your business.
How to Navigate Wiise Warehouse Dashboards in Power BI?
Each tile on the Wiise Warehouse dashboards are interactive and customisable.
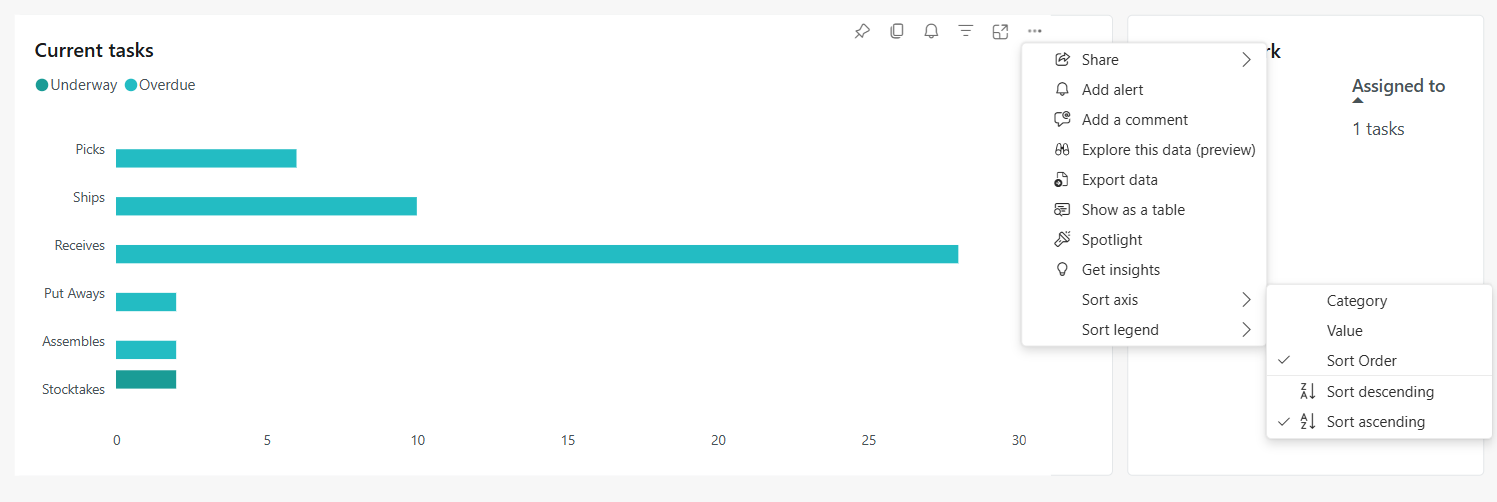
- From the icons on the top right-hand corner of each tile, you can perform the following actions:
- Pin the task.
Note: Read only content cannot be pinned to the report. - Copy as image with caption.
- Add alerts.
- Filter your views.
- View on focus mode.
- Share the tile as link, chat in Teams or Open in PowerPoint.
- Start a conversation with your team and add a comment.
- Preview and explore the data and format to your views by rearranging the X and Y axis view.
- Export the data in an excel spreadsheet.
- Show data as a table.
- Pin the task.
- You now know how navigate and use the Wiise Dashboards.
Note: Some high-level summary tiles cannot be filtered. If you have feedback on the data or how you’d like it presented, please review the calculation metrics first and then contact Wiise Support at support@wiise.com for further inquiries.
What’s next?
Find out how to set up and use Wiise Finance Dashboards.
Need more help?
No problem, that's what we're here for. Reach out to support@wiise.com anytime you can't find what you're looking for.