Overview:
- Learn to use Warehouse Insights report
- Learn to use Warehouse Planner report
- Learn to use Warehouse Manager report
- Learn to use Wiise Landed cost report
Why Use Wiise Warehouse Dashboards in Power BI?
Wiise Warehouse Dashboards in Power BI give you a clear view of warehouse tasks, stock levels, and team activity in real time. They help you plan, track, and manage operations more efficiently.
Prerequisites:
- You have installed and connected the Wiise Warehouse Dashboards to Power BI
How to Use the Warehouse Insights report?
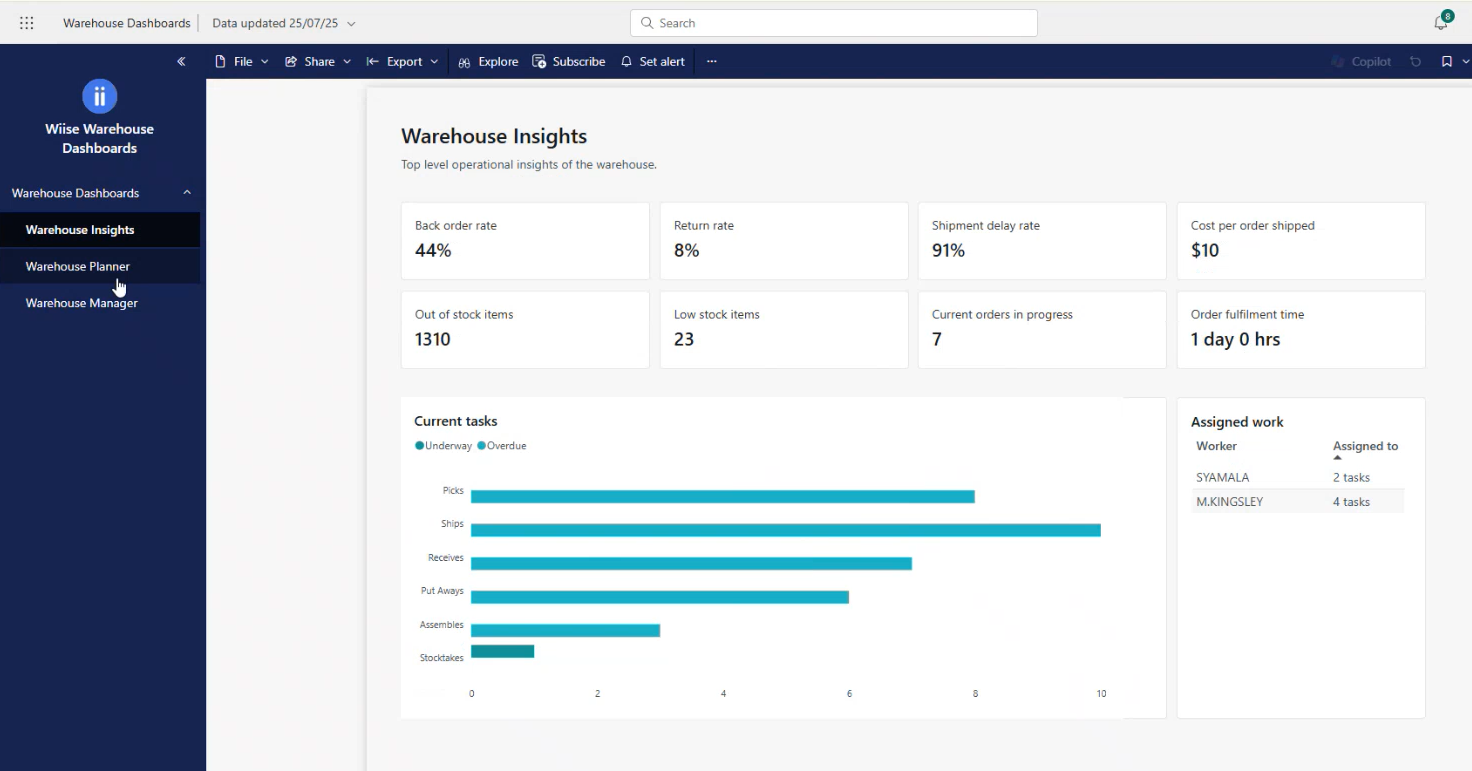
Here are the metrics to use the Wiise Warehouse Insights Dashboard.
|
Warehouse Insights Metrics |
||
|
Metric |
Calculation |
Objective |
|
Back Order rate |
This metric is expected to be released in November 2025. |
The Back Order Rate measures how often sales orders cannot be fulfilled straight away because of insufficient stock. It helps monitor stock availability and highlights potential gaps in inventory planning. |
|
Return Rate |
Sum Quantity in Return Receipt Line / Sum Quantity in Sales Shipment Line x 100
|
The Return Rate measures the percentage of goods shipped in the last 30 days that are returned by customers. It helps identify product quality issues, fulfilment errors, or customer satisfaction problems by showing how much of what you shipped comes back. |
|
Shipment delay Rate |
Delayed Shipments / Total Shipments x 100% in the last 30 days. |
Shipment Delay Rate shows how often goods are shipped later than the promised date in the last 30 days. |
|
Cost per Order shipped |
Sum of (posted shipment line quantity x posted shipment line unit cost) / total posted sales shipment in the last 30 days |
The Cost per Order Shipped measures the average cost of fulfilling each sales order over the last 30 days. It helps assess shipping cost efficiency, monitor profitability per order, and supports cost control and operational analysis. |
|
Out of Stock items |
Items with inventory = 0 |
Identifies items that are completely out of stock. Good for urgent replenishment decisions. This reflects the status. |
|
Low stock Items |
Count of items in the Item table where Inventory < Reorder Point. |
The Low Stock Items metric identifies items with inventory levels below their predefined reorder point. It helps monitor stock approaching depletion and supports proactive restocking decisions. This metric reflects current inventory levels without a date filter. |
|
Current orders in progress |
Count of Released Sales Orders where Completely Shipped = False. |
The Current Orders in Progress metric shows sales orders that are still being fulfilled. It helps track the active order pipeline and workload by highlighting orders not yet completely shipped. This metric reflects the status and does not use a date filter. |
|
Order fulfilment time |
Average of (Shipment Date – Order Date) for sales orders in the last 30 days. |
Tracks the average time taken to fulfil an order. Useful for monitoring customer service levels and logistics efficiency. |
|
Picks underway |
Count of warehouse documents where Document Type = Pick and Due Date ≥ Today. |
Represents pick tasks in progress. Helps monitor workload and plan warehouse operations. |
|
Picks overdue |
Count of warehouse documents where Document Type = Pick and Due Date < Today |
Highlights pick tasks that are late. Useful for addressing delays in warehouse operations. |
|
Ships underway |
Count of shipments where Shipment Status = Open and Due Date ≥ Today. |
Shows shipments currently being processed. Good for managing outbound logistics and resource. |
|
Ships overdue |
Count of shipments where Shipment Status = Open and Due Date < Today. |
Identifies delayed shipments. Useful for proactive issue resolution. |
|
Receives Underway |
Count of receipts where Receipt due date ≥ today |
Represents incoming shipments in progress. Good for inbound logistics and planning. |
|
Receives Overdue |
Count of receipts where Receipt due date < today |
Shows late inbound shipments. Useful for resolving supplier delays. |
|
Putaways Underway |
Count of warehouse activities where Type = Putaway, due date ≥ today |
Tracks stock being moved to final storage locations. Useful for warehouse space management. |
|
Putaways Overdue |
Count of warehouse activities where Type = Putaway, due date < today |
Indicates delay in stock storage. Important to monitor the warehouse for efficiency and avoid any storage constraint. |
|
Assembles Underway |
Count of assembly orders where Status = Released, filtered by due date |
Tracks in-progress assembly tasks. Useful for production scheduling. |
|
Assembles Overdue |
Count of assembly orders where Status = Released, filtered by due date < today
|
Highlights late production tasks. Useful for identifying production constraints. |
|
Stocktakes Underway |
Count of stocktake documents where Status = Open |
Represents inventory counts in progress. Useful during scheduled stocktakes. |
|
Assigned work |
Group by assigned user ID for unposted warehouse task: Count warehouse shipment + count warehouse receipt + count warehouse activity header (pick and put away)
|
Monitors workload distribution by user. Useful for managing team performance, task and resource allocation. |
How to Use Warehouse Planner dashboard?
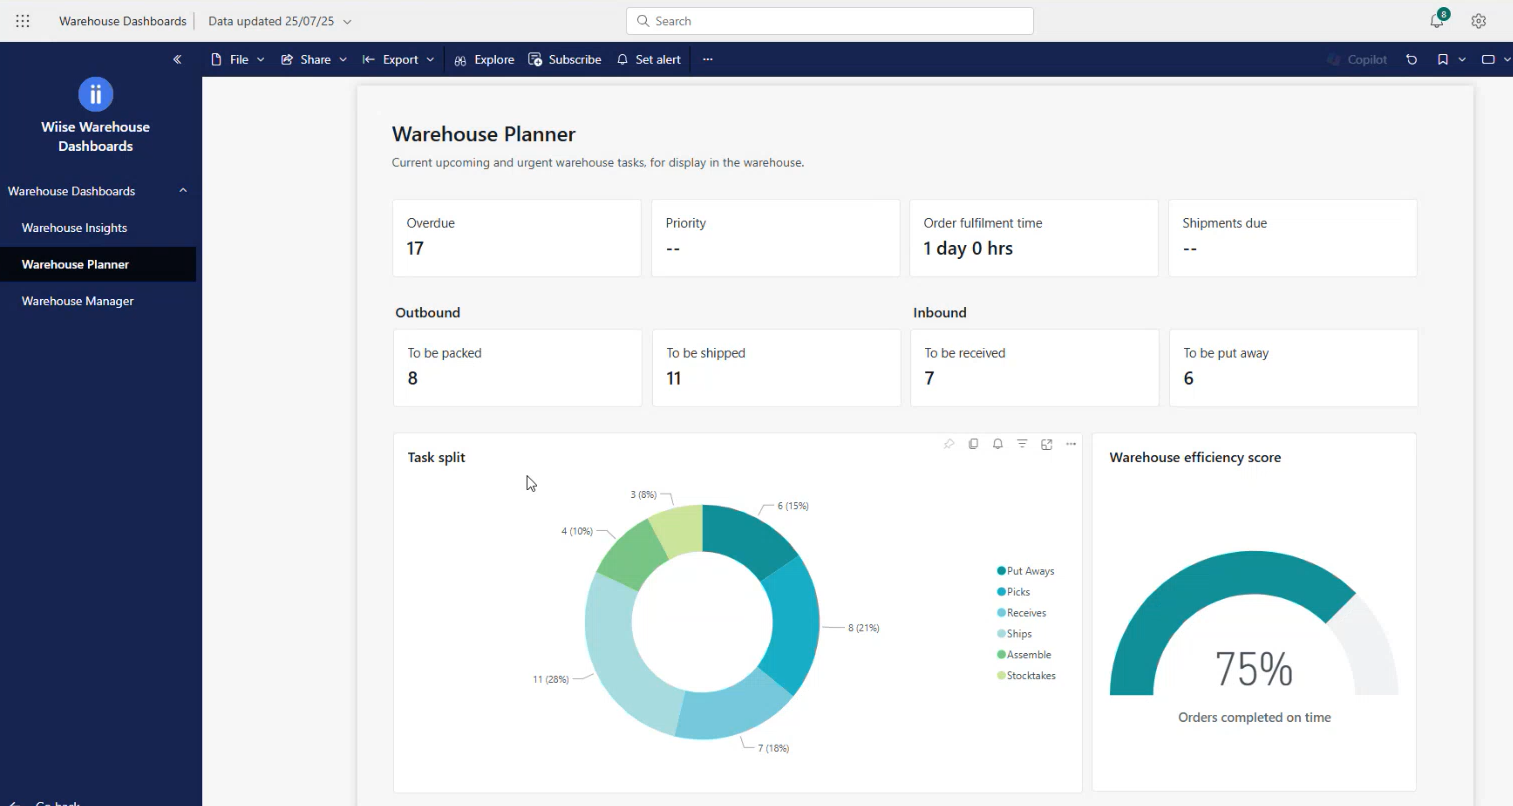
Below is a list of all fields used in the Warehouse Planner dashboard.
Learn how each metric is calculated and what it helps you track.
|
Warehouse Planner Metrics |
||
|
Metric |
Calculation |
Objective |
|
Overdue |
Count of warehouse activities where due date < today |
Identify delayed tasks to prioritise rescheduling or reassignment. |
|
Priority |
Count of warehouse activities of pick and put-away where due Date = today or tomorrow |
Surface urgent activities that must be completed soon. |
|
Order fulfilment Time |
Average (shipment date - order date) for sales shipments in the last 30 days |
Measure processing speed and efficiency of order handling. |
|
Shipment due |
Count of unposted warehouse shipments where shipment Date = today |
Track daily shipment load for dispatch scheduling. |
|
To be packed |
Count of Warehouse Picks
|
Show orders that have been picked and are ready to be packed. |
|
To be shipped |
Count of Warehouse Shipments |
Monitor pending shipments to manage dispatch and logistics. |
|
To be received |
Count of Warehouse Receipts |
Track expected incoming inventory to prepare for goods-in activities. |
|
To be put-away |
Count of Warehouse Put Aways
|
Display inbound inventory awaiting placement into storage. |
|
Task Split - Picks |
Count of all picks from warehouse activity headers |
Identify how many pick operations are active or pending. |
|
Task Split - Ships |
Count of warehouse shipment headers |
Quantify shipping operations in progress. |
|
Task Split - Receives |
Count of warehouse receipt headers |
Show current receiving activities in the warehouse. |
|
Task Split – Put-aways |
Count of warehouse activities with document Type = Put-away |
Determine how many items need to be stored or shelved |
|
Task Split - Assemble |
Count of assembly headers where status = Released |
View current assembly tasks underway to plan resources and track progress. |
|
Stocktakes |
Count of Physical Inventory Record Headers where status = Open |
Highlight ongoing or pending inventory counts to support accuracy and audit readiness. |
|
Orders Completed on Time (Warehouse efficiency score)
|
Percentage of shipments where shipment date <= promised Delivery Date in last 30 days |
Evaluate performance against customer delivery commitments. |
How to Use Warehouse Manager dashboard?
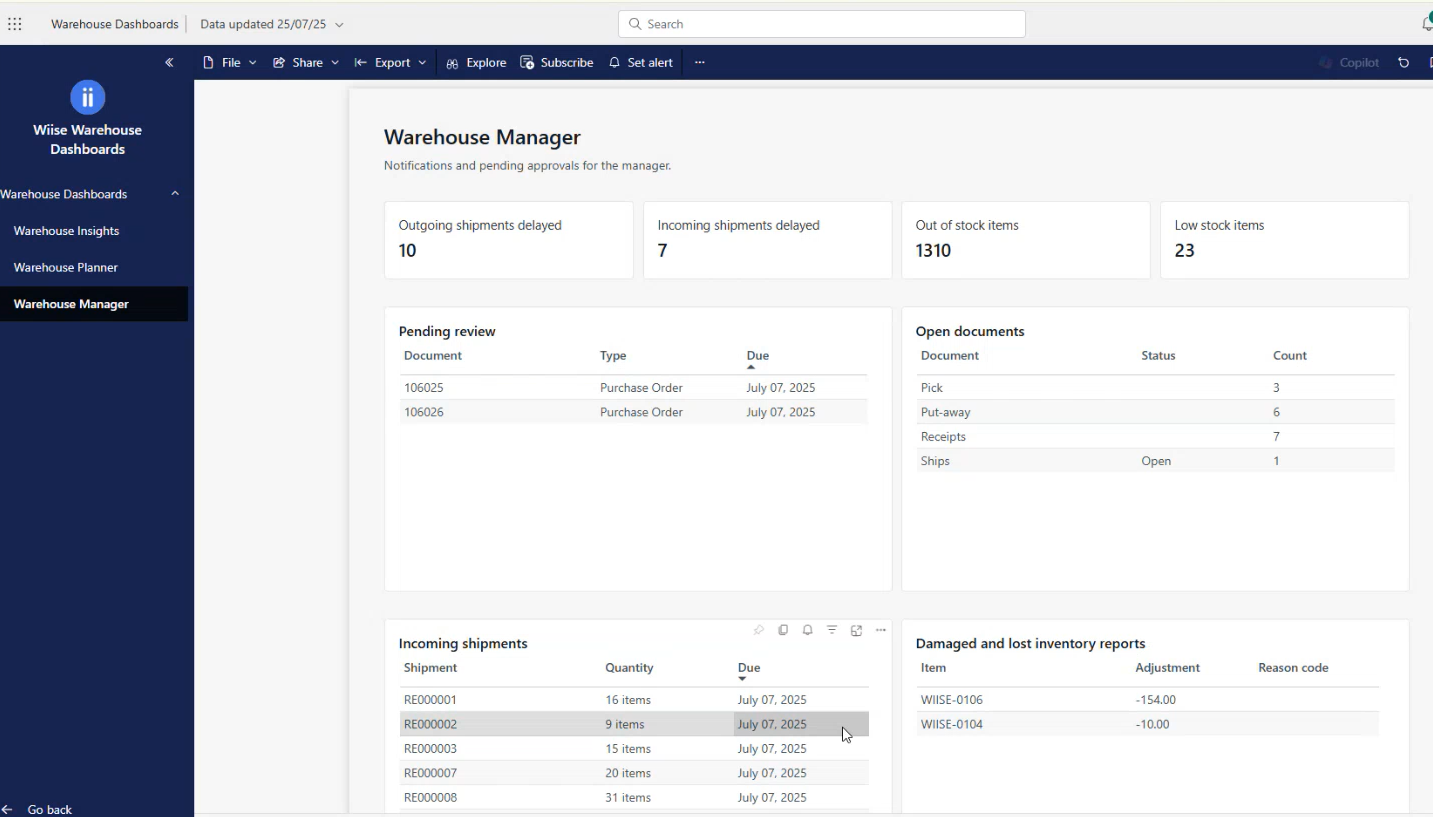
Below is a list of all fields used in the Warehouse Manager dashboard.
Learn how each metric is calculated and what it helps you track.
|
Warehouse Manager Metrics |
||
|
Metric |
Calculation |
Objective |
|
Outgoing Shipments delayed |
Warehouse Shipments with shipment date < today |
Identify delayed customer shipments to reduce delivery lags and improve fulfilment performance. |
|
Incoming Shipments delayed |
Receipts where warehouse receipt line due date < today |
Detect supplier delays and adjust receiving or replenishment plans accordingly. |
|
Out of Stock items |
Items with inventory = 0
|
Highlight stockouts to trigger urgent reordering and prevent sales disruptions. |
|
Low Stocks |
Items with stock levels below the reorder point or showing negative inventory |
Monitor low inventory levels to proactively replenish before stockouts occur. |
|
Pending Review |
List of Sales Orders and Purchase Orders with Status ‘Pending Approval’ |
Track documents awaiting approval to prevent processing delays. |
|
Open Documents |
Count of Warehouse receipts and Sales Shipments
These include picks, put-aways, shipments, receipts, |
Monitor operational workload and identify tasks that require action or assignment. |
|
Picks missing stock |
Pick No: The pick that needs attention Missing stock: How many item lines in that sales order is missing stock Due: when the pick was scheduled to be completed. Note: If there are more lines, the earliest due date is selected to show here. Location: The warehouse location where the shortage occurred. Search via: You can drill into the Warehouse Picks to view the exact line causing the shortage. |
Shows you how to identify pick lines that cannot be fulfilled due to insufficient stock, so your warehouse team can restock, substitute items, or adjust their picking plan early to prevent delays. |
|
Items in Out of Stock Picks |
Select a Pick that’s missing stock on the Picks missing stock tile. It show you the item’s inventory level in real-time Inventory level = Projected Available Balance (in Item Availability by Location) + Expected Quantity Item: The SKU that is out of stock picks Inventory Level: Current on-hand inventory (negative means oversold, mispicked, or unposted receipts). Earliest Expected Availability: The date the stock is expected to be available. Expected Quantity: Quantity expected to arrive on the earliest replenishment. You can drill into the specific Item Availability by Location. |
Shows items that have dropped below zero inventory and are delaying multiple picks. This allows warehouse managers to prioritise replenishment (based on the predicted restock date), investigate negative stock issues, and communicate accurate fulfilment timelines. |
|
Incoming shipments |
List of Warehouse Receipts |
Provide visibility into expected inbound goods for planning and coordination. |
|
Damaged and Lost Inventory reports |
list item ledger entries where entry type = negative adjustment |
Track inventory loss and damage trends for review and audit. |
|
Recent Orders |
List of Sales Orders |
Review the latest sales activity for prioritisation and customer service insights |
How to Use the Wiise Landed Cost report?
Before you Begin:
-
Select the Period drop-down to select the date range for your Landed Cost report:
-
This week: From the first day of the week to today.
-
This month: From the first day of the current month to today.
-
This quarter: From the first day of the quarter to today.
-
This fiscal year: As set up in Wiise (default: 1 July to 30 June).
-
This calendar year: From 1 January to today.
-
-
Supplier: Selecting one, a few or all suppliers or vendors determines how your landed cost report is calculated.
-
Item: Select related items for your landed cost report.
-
Here’s what you need to know how to read the Wiise Landed Cost dashboard:
-
Data is pulled from the Item Ledger Entries which represents your landed costs calculations
-
Entry Type is Purchase
-
Source Type is Vendor
-
Document Type is Purchase Receipt
-
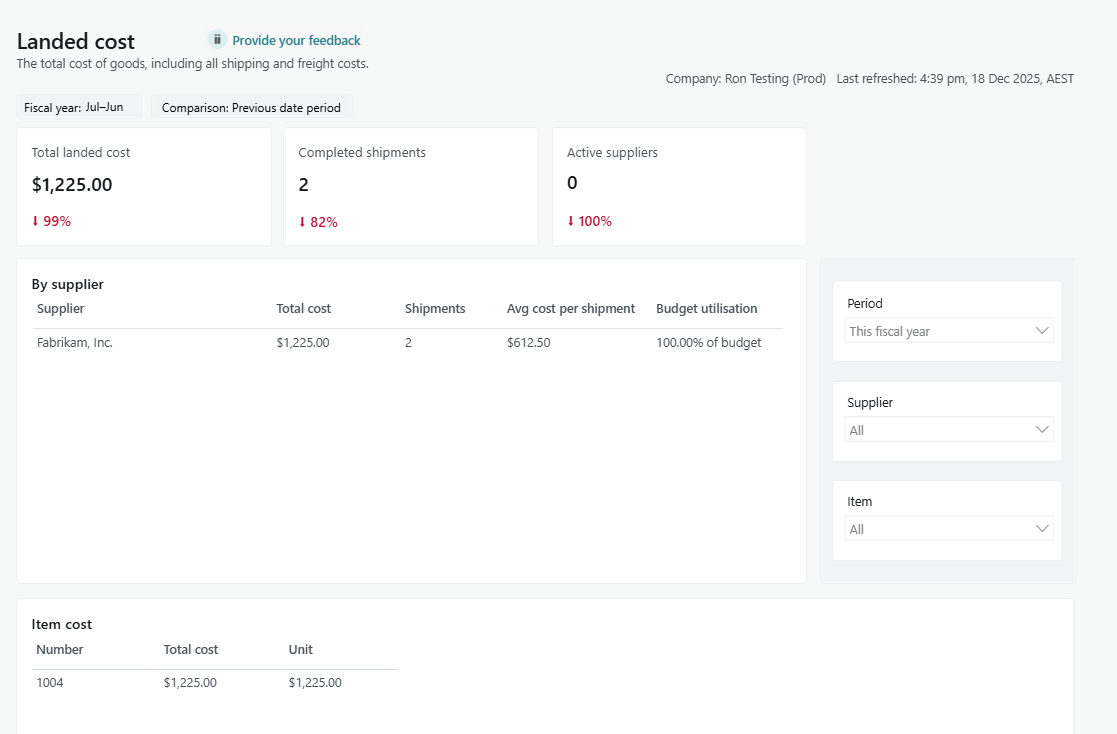
- Here are the metrics to use the Landed Cost Dashboard
| Landed Cost Metrics | ||
| Metric | Calculation Updated | Objective |
| Total Landed Cost | Total Landed Cost = Sum of Actual Landed Cost Amount minus Item Charges Budget Amount plus Reversed Budget Amount, filtered by posting date, supplier, and item. Variance Rate % = ((Total Landed Cost - Total Landed Cost Previous Period) / Total Landed Cost Previous Period ) x 100 |
Understand total spend on procurement including all landed cost components. Identify cost trends, cost escalations and supplier performance impact. |
| Completed Shipments | Completed Shipments = where Entry Type = Purchase, Document Type = Purchase Receipt. Variance Rate% = ((Completed Shipments - Previous Completed Shipments) / Previous Completed Shipments) x 100 |
Measure inbound fulfilment volume and operational throughput. Identify changes in workload or supplier delivery patterns. |
| Active Suppliers | Active Suppliers = Total number of unique documents based on the Source No. where Entry Type = Purchase, Document Type = Purchase Receipt, Source Type = Vendor. Variance Rate% = ((Current Active Suppliers - Previous Active Suppliers) / Previous Active Suppliers) x 100 |
Track engagement level across suppliers, diversification, and supplier dependency. |
| By Supplier | ||
| Supplier | The vendor names by unique Source No. filtered by Entry Type = Purchase, Source Type = Vendor and Posting Date | Identifies suppliers with landed cost components |
| Total Cost | Total Cost per Supplier = Sum(Cost Amount Actual minus Item Charges Budget Amount plus Reversed Budget Amount). | Identify high cost suppliers and monitor freight or duty impact per supplier. |
| Shipments | Shipments per Supplier = Total number of unique documents based on the Document No. field grouped by Supplier. | Measure delivery frequency and reliability. |
| Average Cost per Shipment | Avg Cost per Shipment = Total Cost per Supplier divided by Shipments per Supplier. | Compare supplier efficiency and cost effectiveness. |
| Budget utilisation | Budgeted Cost = Direct Cost plus Budgeted Landed Cost. Utilisation % = (Actual minus Budget) divided by Budget multiplied by one hundred. |
Identify cost overruns and detect suppliers with large deviations from budget. |
| Item Cost table | ||
| Number | Description of Item | Shows the description of the item number |
| Total Cost | Landed Cost per Item = Sum(Cost Amount Actual minus Item Charges Budget Amount plus Reversed Budget Amount). | Provide visibility into true item acquisition cost to improve pricing, margin and purchasing decisions. |
| Unit | Unit Cost = Sum(Direct Cost) grouped by Item. | Support accurate margin analysis and cost tracking. |
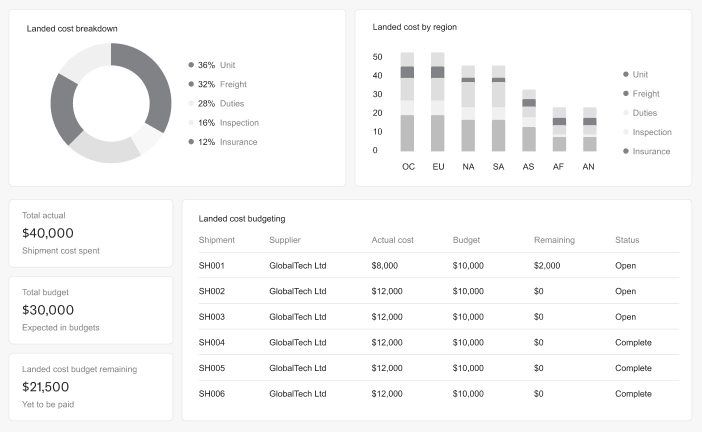
| Landed cost breakdown | Category % = Category Total divided by Total Landed Cost multiplied by one hundred. | Identify major cost drivers (freight, duties, insurance, other). |
| Landed cost by region | Regional Cost = Sum(Value Entry Cost Amount Actual) grouped by Country Region Code. | Support geographic cost analysis for multi-regional or multi-warehouse organisations. |
| Landed cost budgeting table | ||
| Shipments | Shows the unique Shipment numbers | |
| Supplier | This shows the suppliers names | |
| Actual | Total Actual = Sum(Actual). | Monitor actual spend against shipment allocations. |
| Budgeted | Total Budget = Sum(Budgeted). | Track expected cost before invoices arrive to support financial planning. |
| Remaining | Remaining = Total Budget minus Total Actual. | Highlight outstanding accruals still expected to be invoiced. |
| Status | The Open or Completed status of the shipment. | |
- You now know how navigate and use the Wiise Warehouse Dashboards.
Note: Download the Wiise Warehouse Dashboard report from the Power BI app to your Power BI Desktop to customise and edit the layout. Once updated, you can upload the customised report and share it with your team.
Note: Some tiles in the Wiise Warehouse Insights Dashboard, particularly high-level summary tiles, cannot be filtered. If you have feedback on the data or how you’d like it presented, you can leave a feedback by selecting this link that's present on every Wiise dashboard:
![]()
Please review the calculation metrics first and then contact Wiise Support at support@wiise.com for further inquiries.
What’s next?
Find out how to use the Wiise Financial Dashboard.
Need more help?
No problem, that's what we're here for. Reach out to support@wiise.com anytime you can't find what you're looking for.