Overview:
- Item Profitability report
- Customer Profitability report
Why Use Wiise Sales Dashboards in Power BI?
Wiise Sales Dashboards in Power BI give you real-time visibility into revenue, cost and margin, with the ability to filter and drill into insights directly where they work. This enables smarter pricing and account decisions, stronger customer negotiations and clearer focus on profitable growth.
Before you Begin:
- Make sure that Wiise Dashboards are installed and connected to Power BI.
- When you access the Item Profitability or Customer Profitabilty reports, you can select various date ranges. Select the Period drop-down to select the date range:
- This week: From the first day of the week to today.
- This month: From the first day of the current month to today.
- This quarter: From the first day of the quarter to today.
- This fiscal year: As set up in Wiise (default: 1 July to 30 June).
- This calendar year: From 1 January to today.
- Sales Person: When you’ve created a Sales Person name in Wiise, you can select the Sales Person to compare against your sales reports.
Tip: To navigate any dashboard, you can hover for tooltips and drill through details.
How to Use Wiise Sales Dashboards in Power BI?
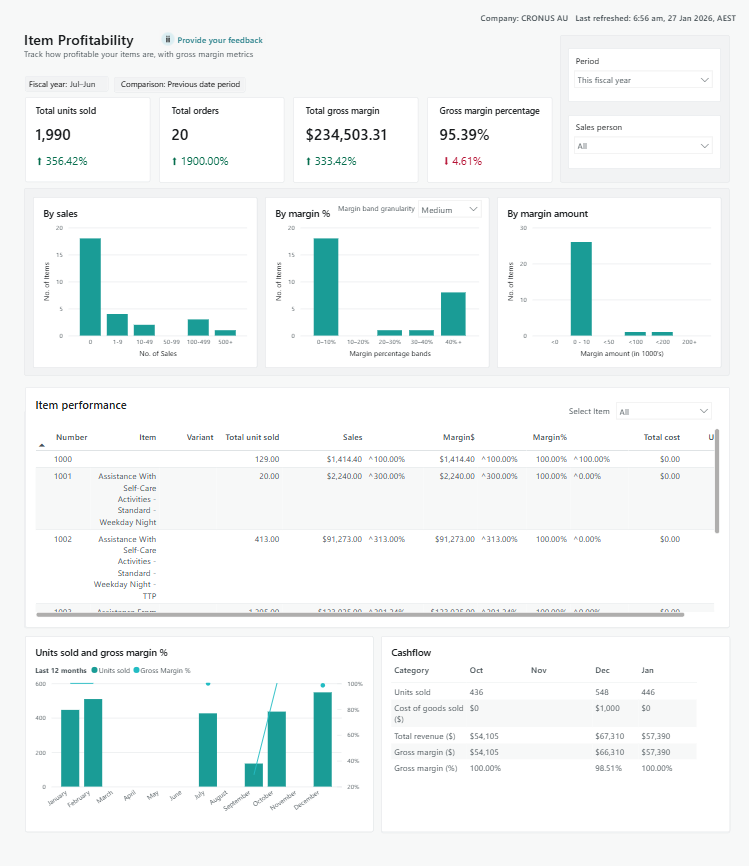
1. Item Profitability
- Select the Item Profitability menu. The Item Profitability Power BI reports display.

- Here’s how to read and understand the tiles on the Item Profitability report metrics:
|
Metric |
Calculation |
Objective |
|
Total Units Sold |
Total number of units sold for each item during the selected period. |
Understand item demand and identify high- and low-volume products. |
|
Total Orders |
Number of unique sales orders that included the item. |
Understand ordering frequency and buying patterns. |
|
Sales Revenue |
Total revenue generated from selling the item. |
Measure how much income each item generates. |
|
Cost of Goods Sold (COGS) |
Total cost associated with items sold. |
Understand the true cost of selling each item. |
|
Gross Margin ($) |
Profit generated from selling the item, in dollars. |
Identify which items generate profit and which erode margin. |
|
Gross Margin (%) |
Profit expressed as a percentage of sales revenue. |
Compare profitability across items regardless of sales volume. |
|
Unit Cost |
Average cost per unit sold. |
Support pricing reviews and cost efficiency analysis. |
|
Landed Cost |
Total cost of an item including additional charges such as freight and duties. |
Ensure profitability reflects full end-to-end costs. |
|
Margin Variance vs Previous Period |
Change in margin compared to the previous period. |
Identify improving or declining item performance over time. |
|
Items by Sales Volume |
Count of items grouped by units sold. |
Identify slow-moving versus high-volume items. |
|
Items by Margin Percentage |
Count of items grouped by margin percentage ranges. |
Highlight low-margin, healthy-margin, and high-margin items. |
|
Items by Margin Amount |
Count of items grouped by total margin dollars. |
Identify items contributing most to total profit. |
|
Item Performance |
Detailed performance per item and variant. |
Support pricing, promotion, and inventory investment decisions. |
|
Units Sold and Gross Margin % |
Total units sold over the last 12 months and gross margin expressed as a percentage of revenue. |
Understand long-term sales volume and profitability trends for items. |
|
Cashflow (Last 4 Months) |
Total units sold, total sales revenue, total cost, gross margin, and gross margin percentage over the last 4 months. |
Monitor recent sales performance and short-term profitability trends. |
- You now know how to navigate and use the Item Profitability report in Power BI.
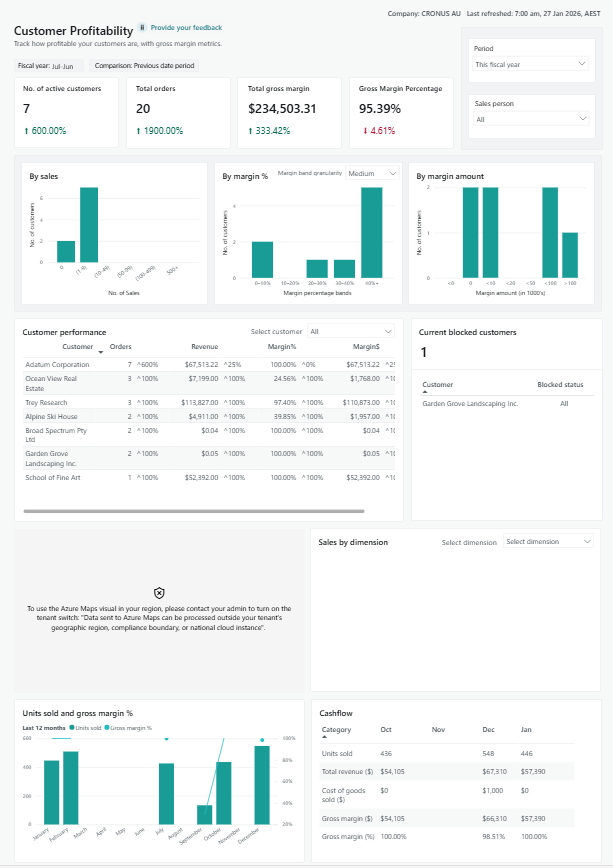
2. Customer Profitability
|
Metric |
Calculation |
Objective |
|
Number of Customers |
Counts distinct customers appearing on posted sales transactions for the selected date range. Variance compares this count to the previous period. |
Track customer base growth or contraction over time. |
|
Total Orders |
Counts distinct sales documents for inventory sales. Variance compares the count to the previous period. |
Understand sales activity levels and ordering behaviour. |
|
Total Gross Margin |
Adds up sales amounts and subtracts total cost amounts. Variance compares current margin to the previous period. |
Measure overall profitability of customer sales. |
|
Gross Margin Percentage |
Percentage of revenue remaining after deducting cost of goods sold. |
Compare profitability performance regardless of revenue size. |
|
Customers by Sales Volume |
Customers grouped into tiers based on number of sales orders. |
Identify high-activity and low-activity customers. |
|
Customers by Margin Percentage |
Margin percentage is calculated per customer and grouped into defined percentage bands. |
Highlight customers with low, healthy, or strong profitability. |
|
Customers by Margin Amount |
Customers are grouped based on total gross margin dollars. |
Identify customers contributing most to profit. |
|
Customer Performance |
Calculates sales, cost, and margin per customer and compares to previous period. |
Support pricing, account management, and negotiation decisions. |
|
Current Blocked Customers |
Displays customers with an active block status on their customer record. |
Identify customers requiring credit or account follow up. |
|
Sales by Region |
Groups sales revenue based on customer address region. |
Understand regional sales performance. |
|
Sales by Dimension |
Groups sales revenue by selected global dimensions such as department or project. |
Analyse performance by internal business structure. |
|
Units Sold and Gross Margin % (12 Months) |
Adds total quantities sold and calculates gross margin percentage over the past 12 months. |
Understand long term customer sales volume and profitability trends. |
|
Cashflow (Last 3 Months) |
Calculates quantities, revenue, cost, and margins using posted sales for the last 3 months. |
Monitor recent customer cashflow and short term performance. |
- You now know how to navigate and use the Customer Profitability report.
What’s next?
Find out how to use the Wiise Financial Dashboard.
Need more help?
No problem, that's what we're here for. Reach out to support@wiise.com anytime you can't find what you're looking for.