Overview:
- Learn the different types of operational reports you can run in Wiise.
Why run other operational reports in Wiise?
Operational reports provide detailed insight into your everyday business process. These reports help your business track performance and provide insights to help make informed decisions.
How to run other operational reports in Wiise?
There are various types of reports available in Wiise that you can run to monitor your business performance.
Note: If you frequently use any of the operational reports, bookmark them as favourites to easily access them from your Wiise landing page.
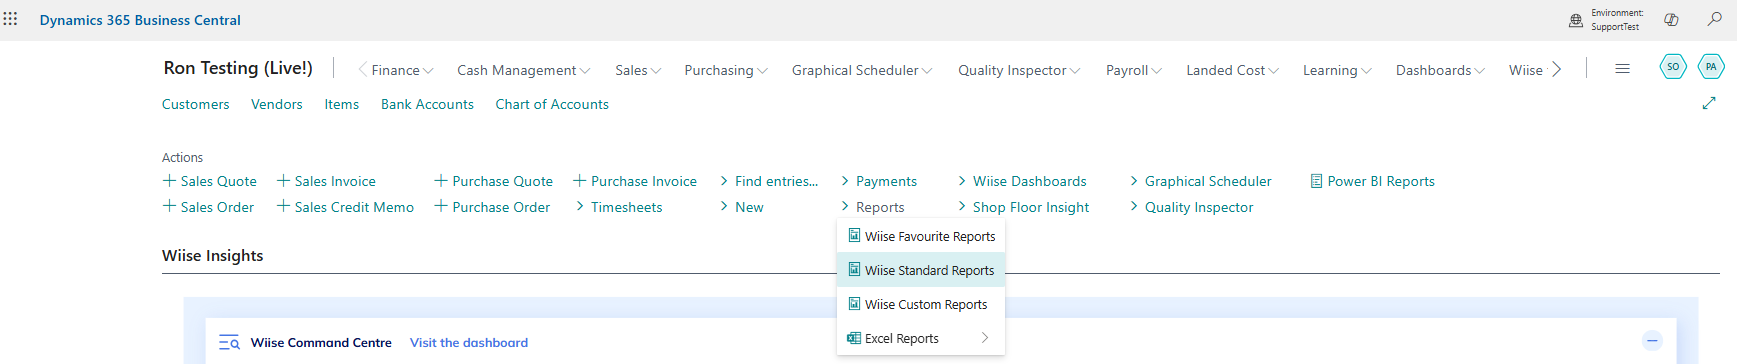
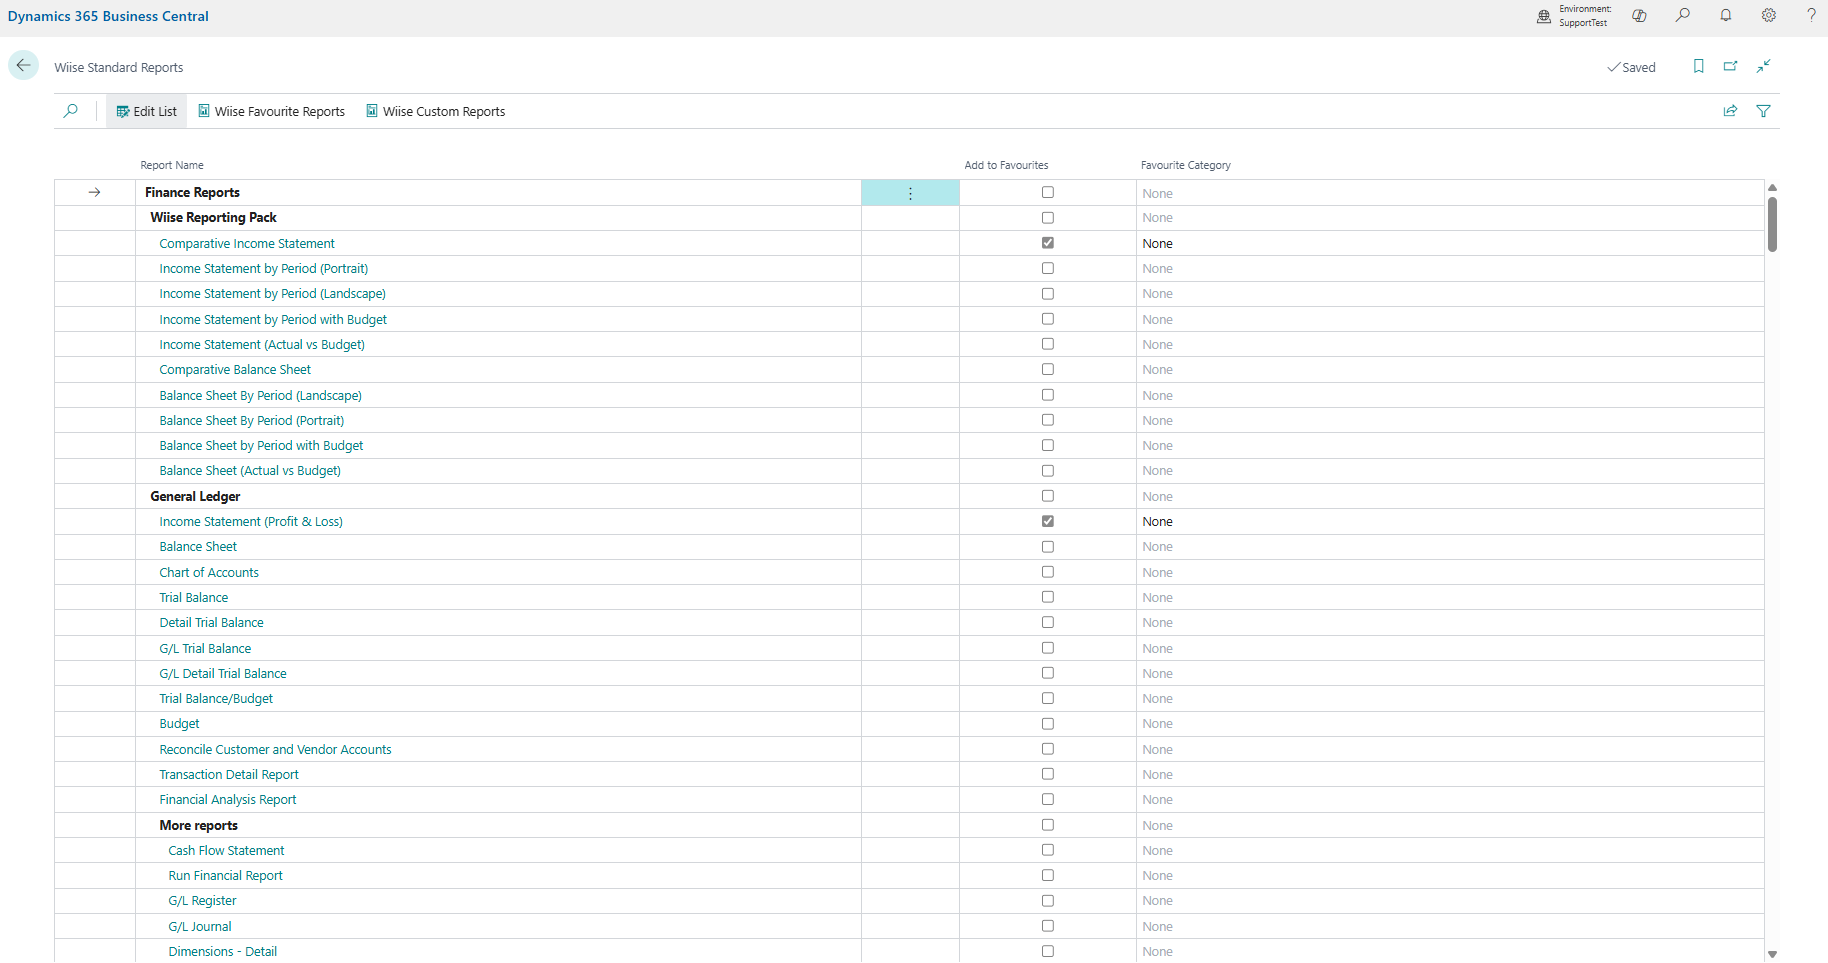
Wiise Standard Reports
You can view a list of Wiise Standard Reports and add your selection of frequently used reports to favourites.- Search for Wiise Standard Reports on the top right-hand corner of your page. Select the related link and the page displays.
Note: You can select Reports from the Actions menu on your Wiise landing page. Select Wiise Standard Reports from the drop-down menu and the list displays.
Note: Wiise Standard Reports are a compilation of all Finance Reports found in Wiise. It consists of a compilation of Wiise Reporting Pack, General Ledger, GST reports, Payables, Cash Management, Fixed Assets, Cost Accounting, Inventory, Receivables, Sales & Marketing, Manufacturing, Warehouse, and more for your business to use.
- You’ve now run the necessary Wiise Standard Reports for your requirements.
Financial Reporting
- You can gain insight into the financial data from your chart of accounts, analyse figures in the general ledger accounts or compare data between the general ledger and budget entries.
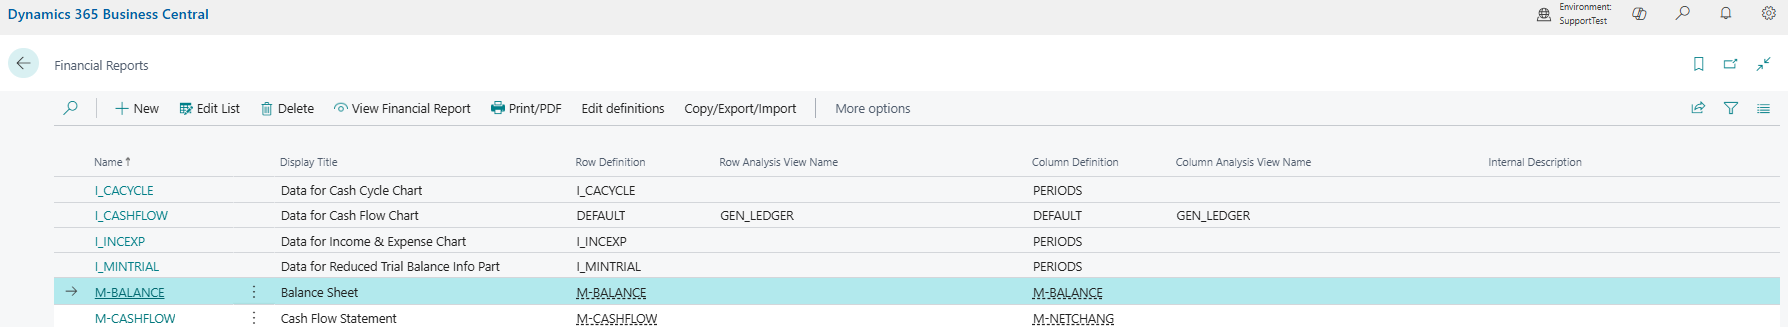
- Search for and select Financial Reports from the top right-hand corner of the page to view all financial reports set up for your business. You can use an existing set up report or create a new one to add custom reports to the page.

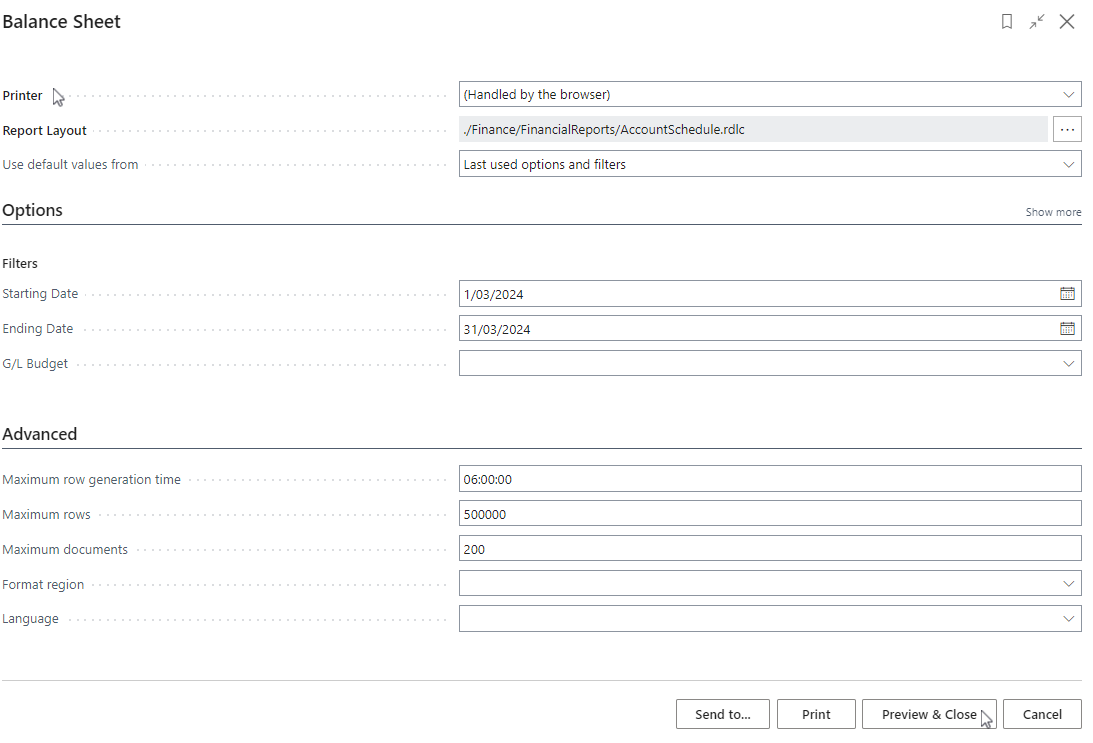
- On the Financial Reports page, select a report to print. Then, select Print/PDF.
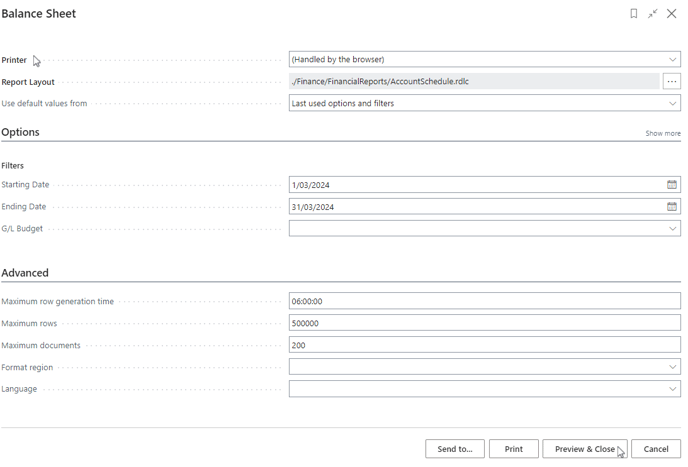
- Fill in the fields as necessary. On the Printer field, select the device from which you’ll print the report.
- Select Preview & Close to review the transactions on the report before you select Print.
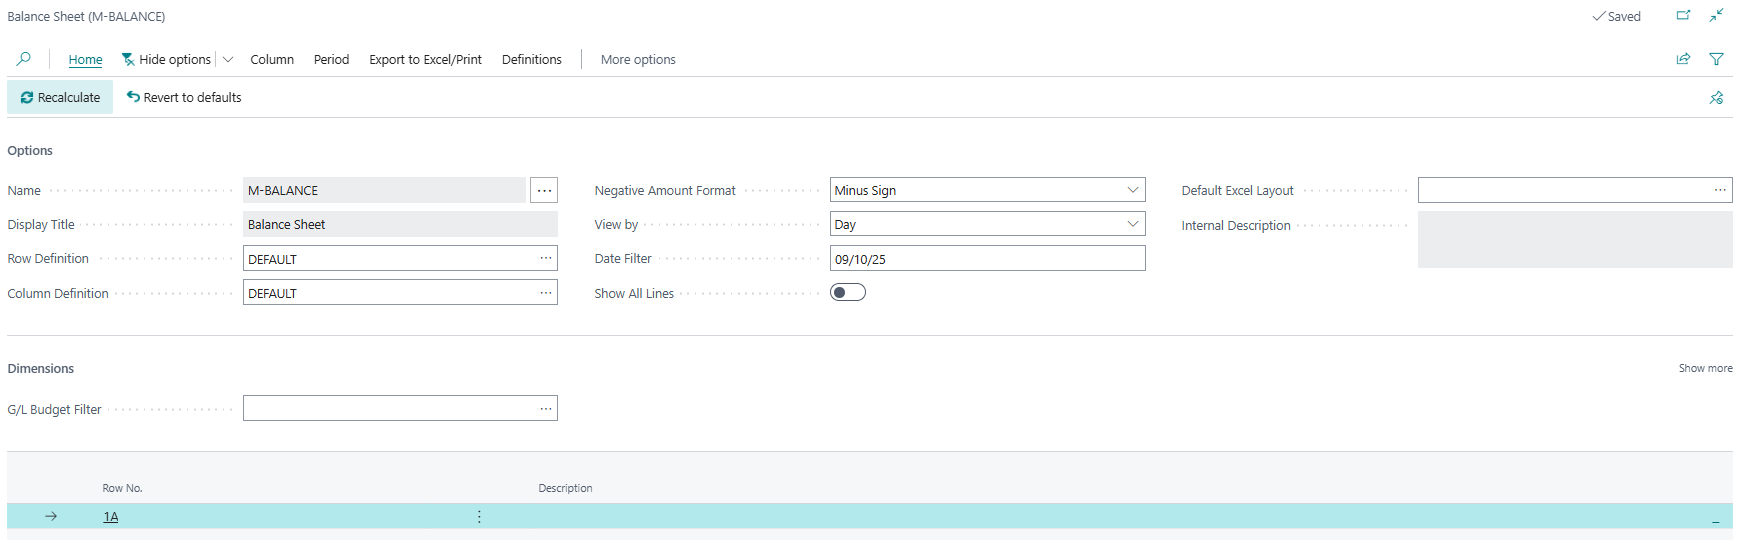
- If you need to recalculate the report, access the report. Select Home. Then select Recalculate.

- Preview the report again and then proceed to print.
- Search for and select Financial Reports from the top right-hand corner of the page to view all financial reports set up for your business. You can use an existing set up report or create a new one to add custom reports to the page.
- You’ve run the Financial Reports.
Note: In Financial Reports, you can select which dimension filter to apply to create a customised report. Dimensions are used to group or categorise data, allowing for deeper analysis of your reports.
Analysis Views
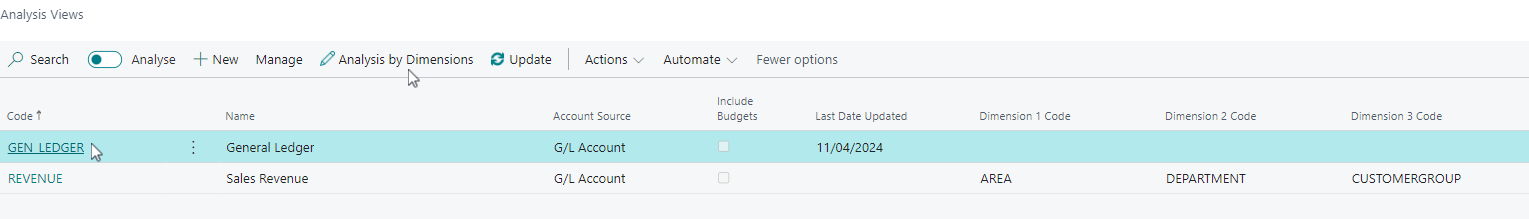
- Search for Analysis Views on the top right-hand corner of the page. Select the relevant link and the Analysis Views page displays.
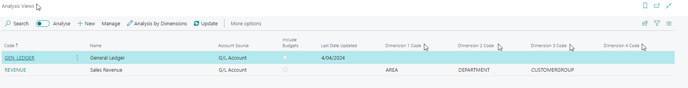
Note: You can update your analysis view card with a selected combination of dimensions to view and choose to refresh the view manually or automatically when new ledger entries are posted.- Select an existing set up analysis view card or create a new analysis view and update your set up.
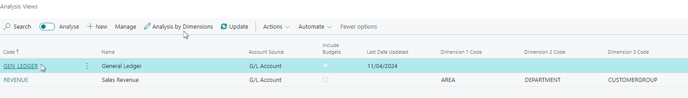
- Select a relevant set up analysis view card row, then select Analysis by Dimensions.
- The Analysis by Dimension request page displays.
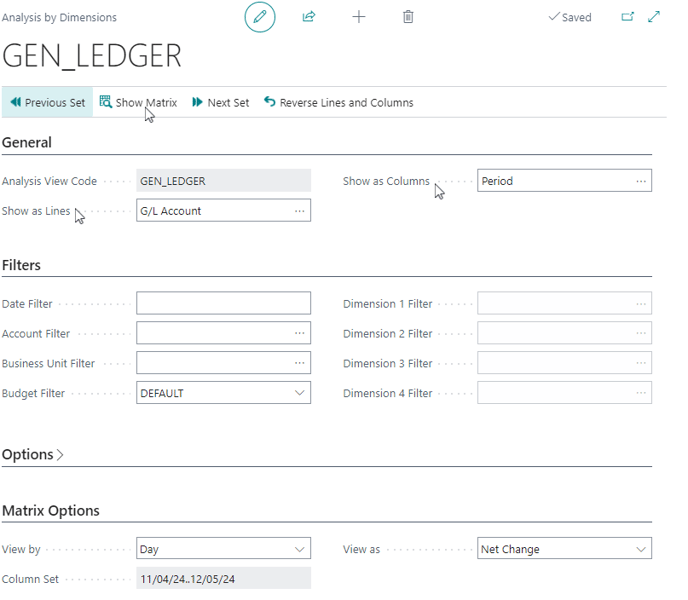
- When you have set the desired filters, select Show Matrix to run the report.
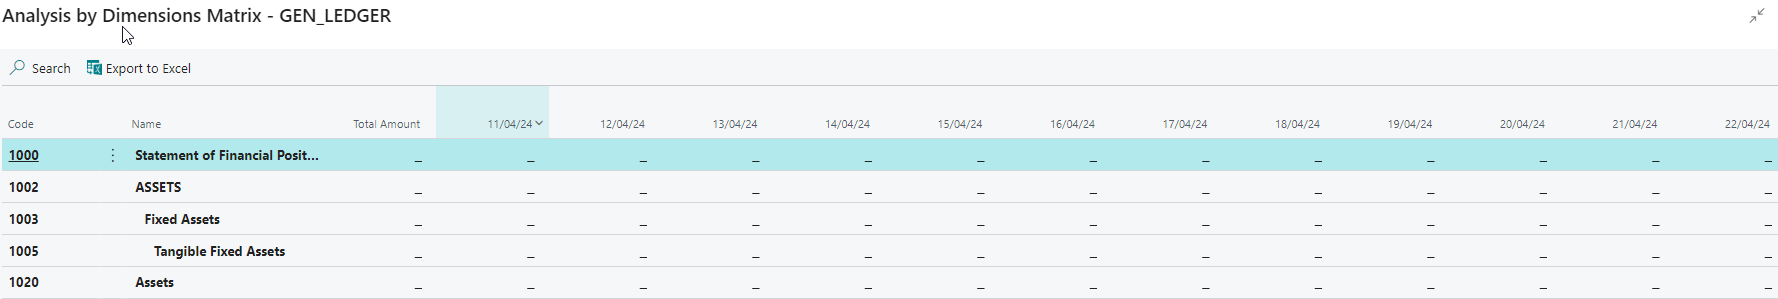
- The Analysis by Dimensions Matrix is generated based on the requirements where the G/L account Show as Lines and Period Show as Columns.

- You’ve run the analysis view by dimensions matrix. You can export this to excel as well.

G/L Balance by Dimensions
- G/L Balance by Dimensions: The G/L Balance by Dimension report allows you to view and analyse your financial data in a granular and insightful manner. Accessing a detailed and segmented view of your financial data enables you to make informed decisions and implement targeted strategies for your business.
-
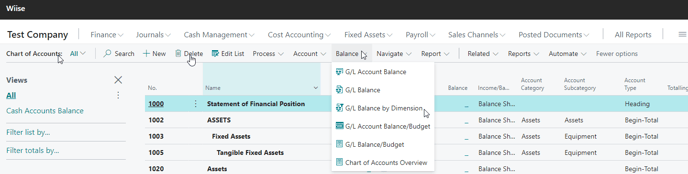
- Select Chart of Accounts from your Wiise landing page. Then, select Balance. From the drop-down menu select G/L Balance by Dimension.
- On the report request page, set various filters to tailor the report to your needs. You can filter by date range, dimension values, or G/L account.
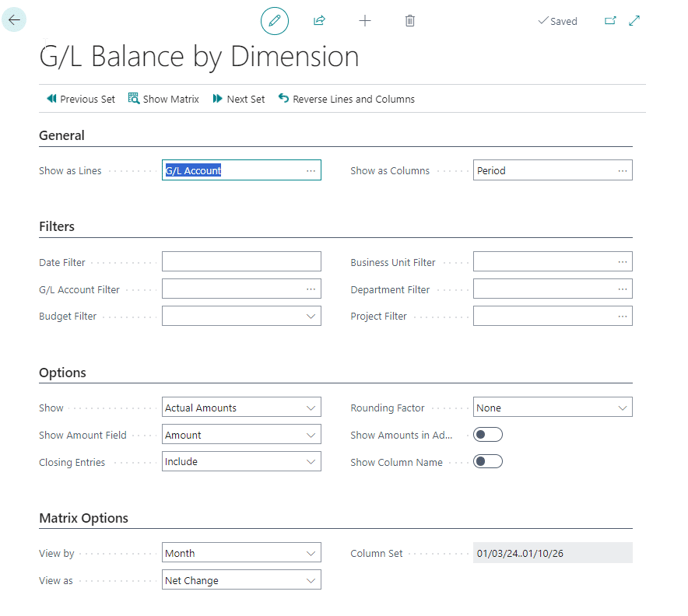
- When you have set the desired filters, select Show Matrix to run the report.
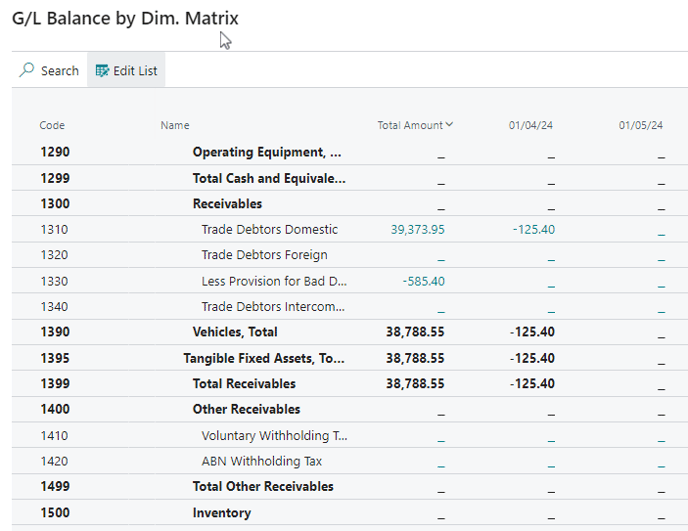
- The G/L Balance by Dim. Matrix report displays the account balances segmented by the selected dimension values.
- The Matrix shows column views by Month, the Amount field is shows against each G/L account.
- Select Chart of Accounts from your Wiise landing page. Then, select Balance. From the drop-down menu select G/L Balance by Dimension.
- You’ve run the G/L Balance by Dimension matrix.


What’s next?
Find out how to write off bad debts.
Need more help?
No problem, that's what we're here for. Reach out to support@wiise.com anytime you can't find what you're looking for.