Overview:
- Understand what's in the Wiise Reporting Pack
- Learn to run reports in the Wiise Reporting Pack
- Add reports to Wiise Favourite Reports
Why use Wiise Reporting Pack?
Use ready made reports to better understand your business performance. These Wiise reports lets you drill down into detailed amounts compared to Business Central standard reports. Their user-friendly layout saves time when exporting to Excel.
What's in the Wiise Reporting Pack?
Here are the reports currently included in the Wiise Reporting Pack:
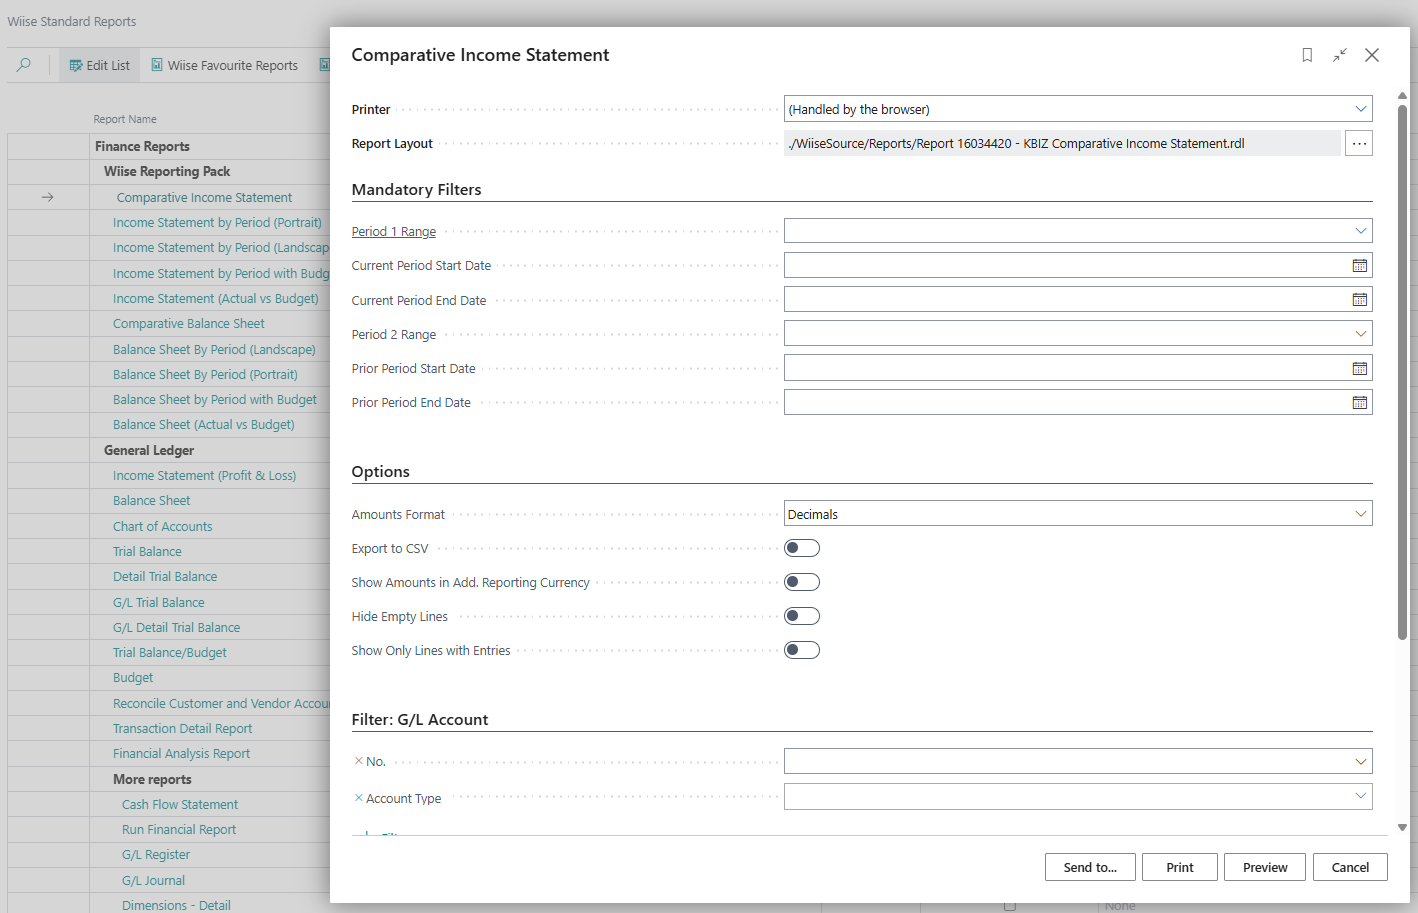
- Comparative Income Statement: Compares two selected periods and shows the growth amount and percentage.
- Income Statement by Period (Portrait): Compares up to 4 periods.
- Income Statement by Period (Landscape): Compares up to 12 periods.
- Income Statement by Period with Budget: Compares 4 periods against budget.
- Income Statement (Actual vs Budget): Compares actuals with budget, showing variance and YTD comparison.
- Comparative Balance Sheet: Compares two periods and shows growth amount and percentage.
- Balance Sheet by Period (Landscape): Compares up to 12 periods.
- Balance Sheet by Period (Portrait): Compares up to 6 periods.
- Balance Sheet by Period with Budget (Portrait): Compares 3 periods against budget.
- Balance Sheet (Actual vs Budget): Compares actual balances with budget, showing variance and year-end comparison.
How to find the Wiise Reporting Pack?
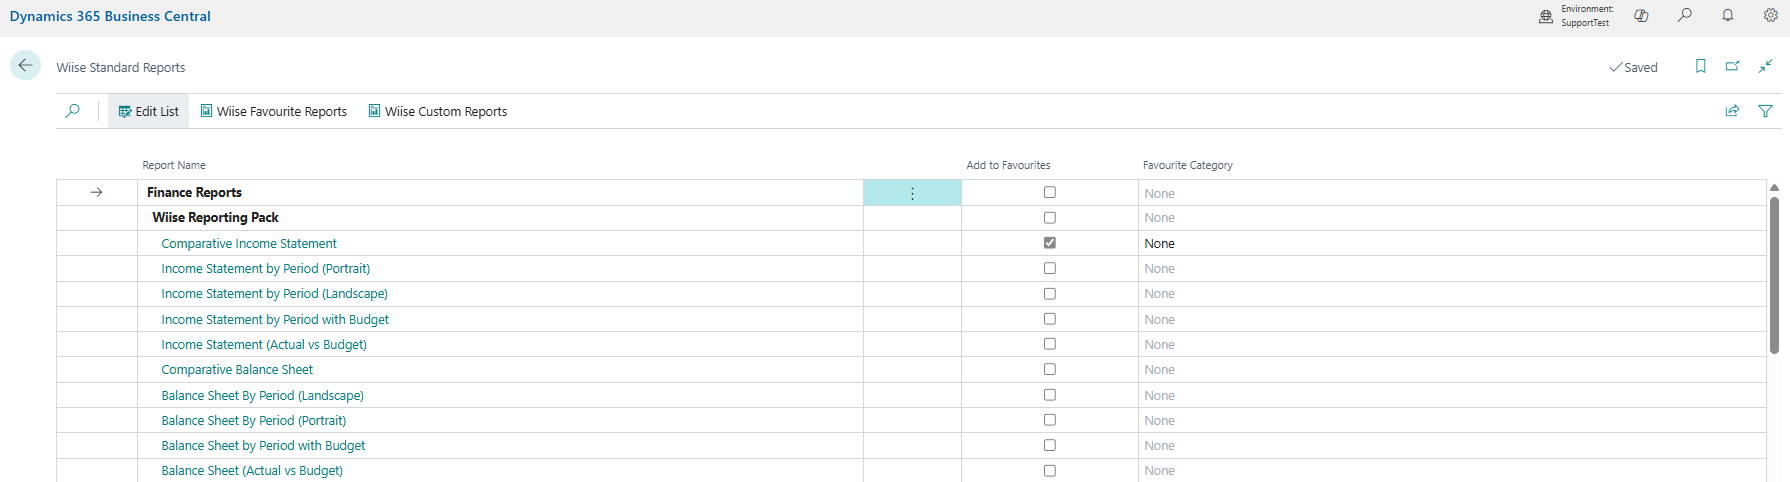
You can view a list of Wiise Reporting Pack reports from Wiise Standard Reports. Here are the steps on how to find the Wiise Reporting Pack:
- Search for Wiise Standard Reports on the top right-hand corner of the page. Select the related link and the page displays.
Note: You can select Reports from the Actions menu on your Wiise landing page (role centre). Select Wiise Standard Reports from the drop-down menu and the list displays. Wiise Reporting Pack is the first compilation of Finance Reports in Wiise Standard Reports.
Note: You can create your own Wiise Favourite Reports list by selecting Add to Favourites for reports that you'll use in the business.
Note: You can bookmark Wiise Standard Reports on your Wiise landing page to easily navigate to your reports.
How to use Wiise Reporting Pack?
- Select a report from the Wiise Reporting Pack list. The report request table displays.

- Fill in the required fields and update the Mandatory Filters. Then, select Preview to review the report before you proceed to Print.
- You now know how to find and use Wiise Reporting Packs.
What's next?
Find out how to set up a new G/L account in your chart of accounts.
Need more help?
No problem, that's what we're here for. Reach out to support@wiise.com anytime you can't find what you're looking for.